Creating and Using Infographics Training Course in United Arab Emirates

Our corporate training course is also available in Dubai, Abu Dhabi, Sharjah, Al Ain, Ajman, Ras Al Khaimah, Fujairah, Umm Al Quwain, Khor Fakkan, Kalba, Dhaid, Ruwais, Muzayri‘, Dibba Al-Hisn, Madinat Zayed, Jebel Ali, Al Quoz, Dibba Al-Fujairah, Ghayathi, Dibba Al-Baya, Liwa Oasis, Al Hamriyah, Masafi, Al Jazirah Al Hamra, Hatta, Ar-Rams, Al Madam, Al Mirfa, and Al Yahar. 
About This Creating And Using Infographics Training Course In Dubai, Abu Dhabi, Sharjah, and UAE

Infographics Course In Dubai, Abu Dhabi, Sharjah, and UAE

This inforgraphic course will equip the training participants with all the necessary skills to be a highly successful at creating infographics using Canva.

  1. Beginner Infographics Course.
  2. Super Easy to Create.
  3. Participants Will Be Able To Create Their First Infographic in 5 Minutes!
  4. No Coding Needed!
  5. No Design Skills Needed!
  6. Just Drag & Drop Infographics Interface.
  7. Over 300+ Free Infographics Templates.
  8. Free Infographics Software!

Information graphics also known as “infographics are visual depictions of information and data created to captivate audiences while delivering effective communications. Infographics surround us every day in the form of charts, plans, and diagrams that help to communicate to and guide us. These visualisations are represented by simplistic pie charts, complex graphs, and visuals that report data over time. Infographics are used in every industry, including journalism, finance, education, marketing, and business. In this course, learners will learn to create beautiful infographics using a variety of tools and techniques

Who Should Attend This Creating And Using Infographics Course In Dubai, Abu Dhabi, Sharjah, and UAE Workshop

This Creating And Using Infographics course In Dubai, Abu Dhabi, Sharjah, and UAE workshop is ideal for anyone who would like to gain a strong grasp and improve their Creating And Using Infographics.

  • Marketers

  • Public Relations

  • Designers

  • Content Creators

Group Size For This Creating And Using Infographics Training Program In Dubai, Abu Dhabi, Sharjah, and UAE

The ideal group size for this Creating And Using Infographics course In Dubai, Abu Dhabi, Sharjah, and UAE is:

  • Minimum: 5 Participants

  • Maximum: 15 Participants

Course Duration For This Creating And Using Infographics Skills Course In Dubai, Abu Dhabi, Sharjah, and UAE

The duration of this Creating And Using Infographics course In Dubai, Abu Dhabi, Sharjah, and UAE workshop is 1 full day. Knowles Training Institute Dubai, Abu Dhabi, Sharjah, and UAE will also be able to contextualised this workshop according to different durations; 2 full days, 1 day, half day, 90 minutes and 60 minutes.

  • 1 Full Day

  • 9 a.m to 5 p.m

Creating And Using Infographics Course In Dubai, Abu Dhabi, Sharjah, and UAE Benefits

Below is the list of course benefits of our Creating And Using Infographics course In Dubai, Abu Dhabi, Sharjah, and UAE

Infographics Course In Dubai, Abu Dhabi, Sharjah, and UAE Benefits – Part 1

  • Infographics assist the companies in getting new traffic and potential customers.
  • Infographics enhances the exposure of the market of a company.

Infographics Course In Dubai, Abu Dhabi, Sharjah, and UAE Benefits – Part 2

  • Infographics enhances the reputation and brand awareness among masses.
  • Infographics assists in building authority and credibility.

Infographics Course In Dubai, Abu Dhabi, Sharjah, and UAE Benefits – Part 3

  • Infographics develops long lasting relations with the audience.
  • Infographics are Persuasive and Eye-Catching.

Infographics Course In Dubai, Abu Dhabi, Sharjah, and UAE Benefits – Part 4

  • Infographics generate More Traffic To Websites.
  • Infographics are Easily Read, Understood, and Remembered.

Infographics Course In Dubai, Abu Dhabi, Sharjah, and UAE Benefits – Part 5

  • Infographics are Great for Search engine Optimisation.
  • Infographics are Portable and Embeddable.

Infographics Course In Dubai, Abu Dhabi, Sharjah, and UAE Benefits – Part 6

  • Infographics enable you to Connect with Your Target Audience.
  • Infographics are Easy to Track and Analyse .

Creating And Using Infographics Course In Dubai, Abu Dhabi, Sharjah, and UAE Objectives

Below is the list of course objectives of our Creating And Using Infographics course In Dubai, Abu Dhabi, Sharjah, and UAE

This course is highly engaging. Only 10% of the overall course content is delivered through lectures. The remaining 90% is delivered through the following practical application exercises

Infographics Course In Dubai, Abu Dhabi, Sharjah, and UAE – Part A

  1. 10 Types Of Infographics With Examples And When To Use Them
  2. Top Tips from Experts on What Makes a Great Infographic
  3. 5 Steps To Create Awesome Infographics
  4. Create The Three Amigos: Bar, Pie And Line Charts.

Infographics Course In Dubai, Abu Dhabi, Sharjah, and UAE – Part B

  1. Effective Ways To Create Data Infographics
  2. How To Choose Colour Schemes For Your Infographics
  3. How To Choose Fonts That Make (Not Break) Your Infographic
  4. How To Get Access To Over 10000+ Free Stock Images For Your Infographics

Infographics Course In Dubai, Abu Dhabi, Sharjah, and UAE – Part C

  1. Effective Ways To Use Infographics For Marketing Campaigns
  2. Using Infographics To Sell Your Cause
  3. Infographic Design Tips To Boost Your Presentations
  4. How To Create Infographics For Social Media

Infographics Course In Dubai, Abu Dhabi, Sharjah, and UAE – Part D

  1. How To Create Amazing Statistical Data-Driven Infographics
  2. Infographic Reports: Make Data Look Cool
  3. How To Visualize Survey Results Using Infographics
  4. Making Timeline Based Infographics

Course Content For This Creating And Using Infographics Training Course In Dubai, Abu Dhabi, Sharjah, and UAE

Below is the list of course content of our Creating And Using Infographics training course In Dubai, Abu Dhabi, Sharjah, and UAE

  • What is meant by creating and using infographics?
  • Highlight the importance of creating and using infographics
  • How to market the products and services effectively?
  • Understand the different techniques of creating and using infographics
  • Case studies and group discussions

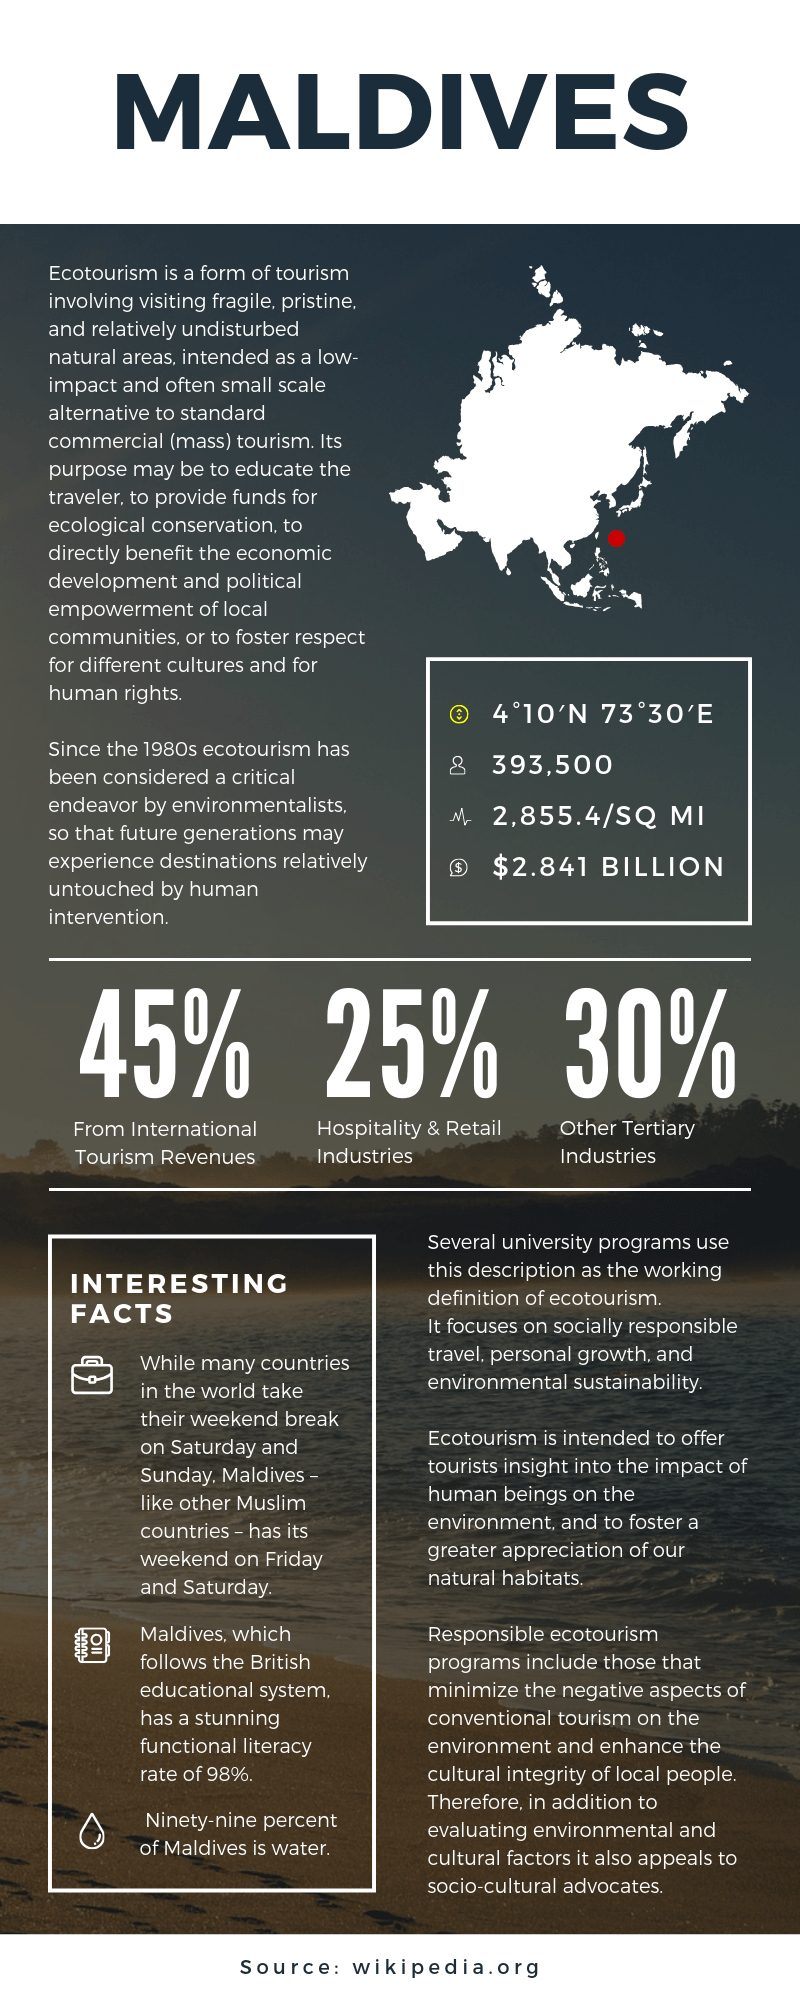
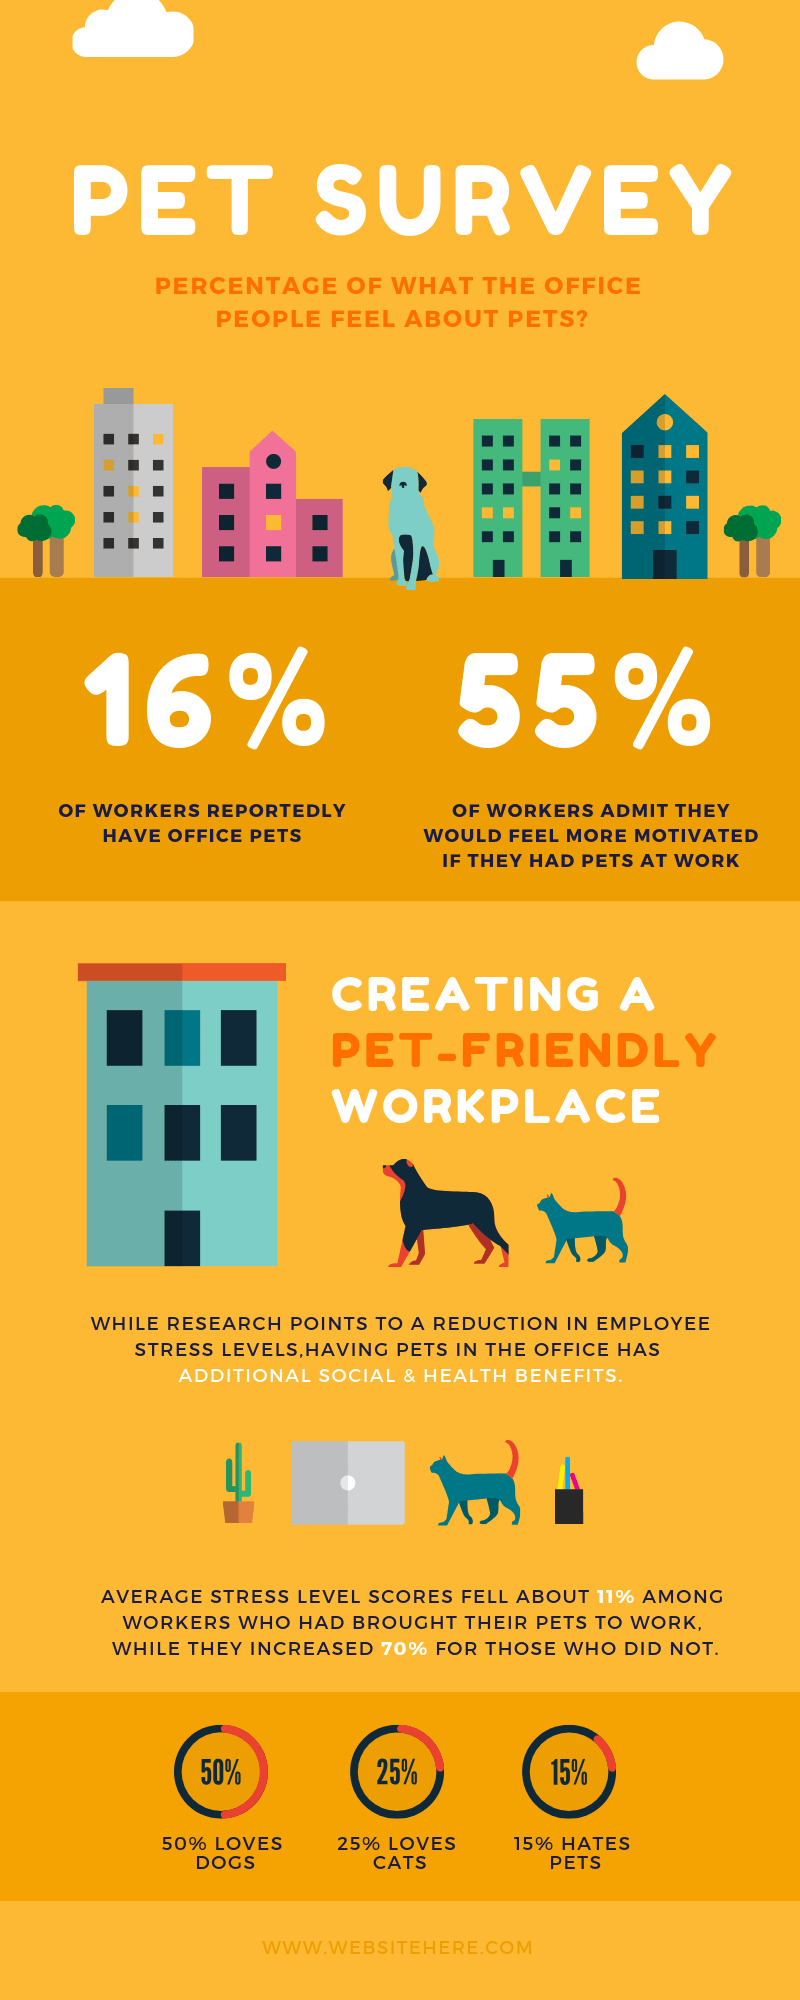
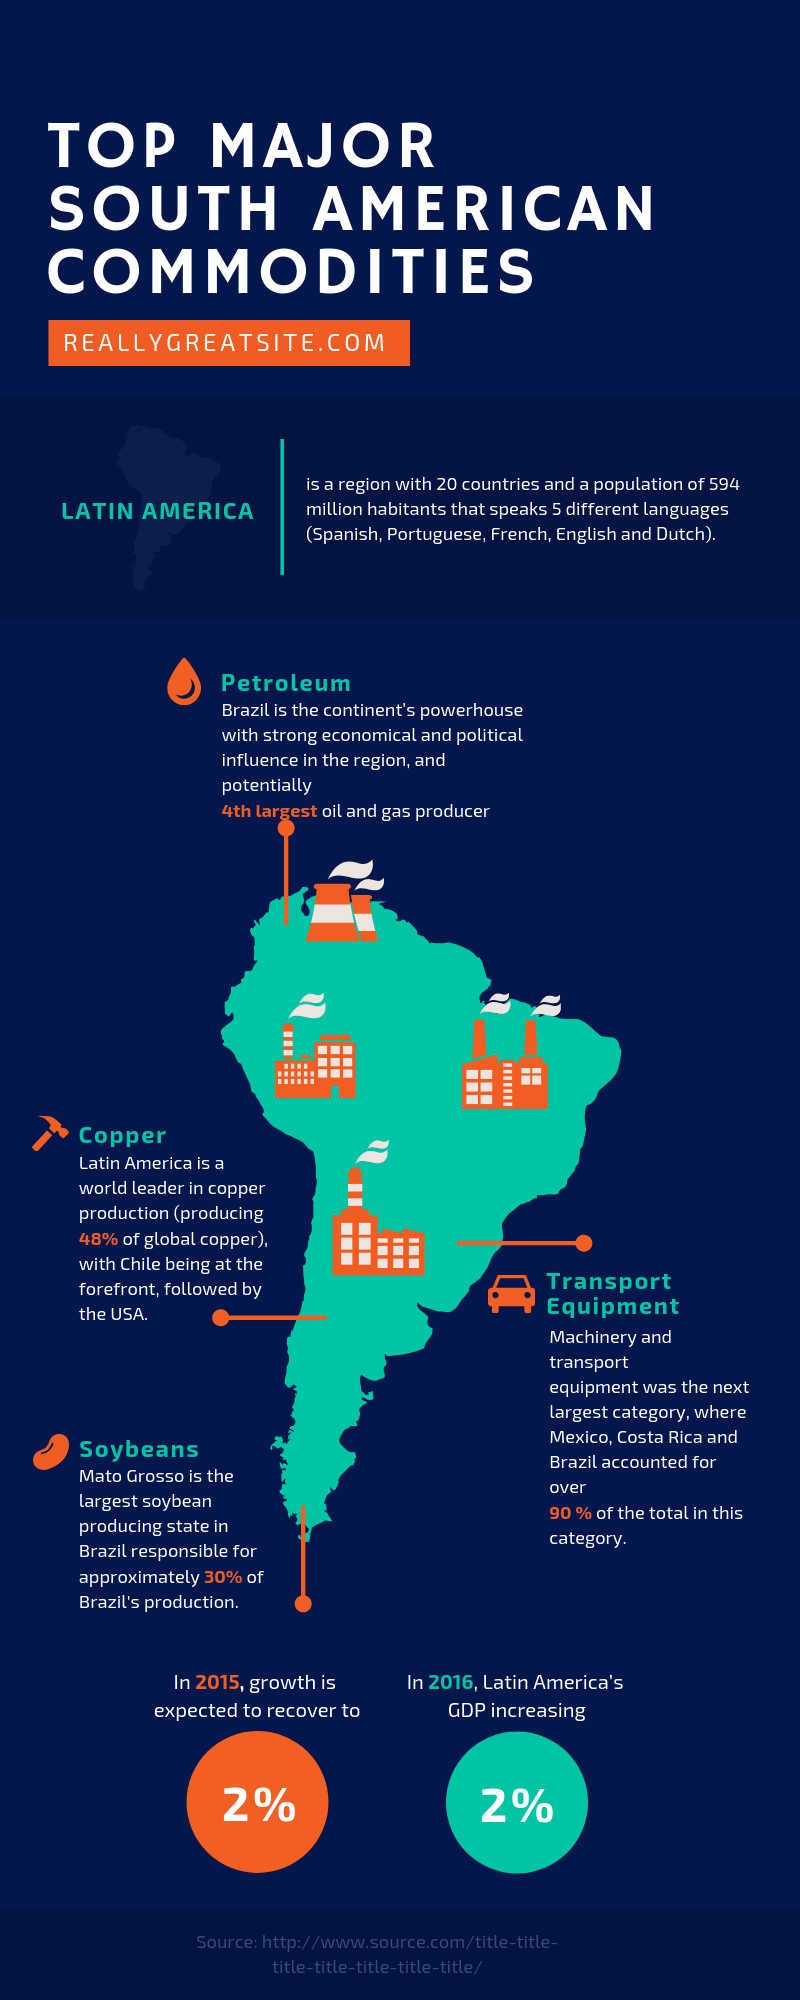
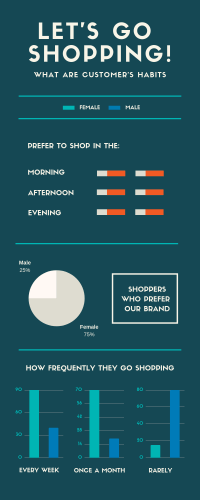
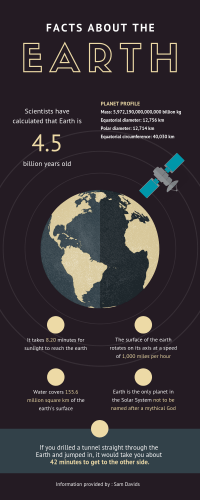
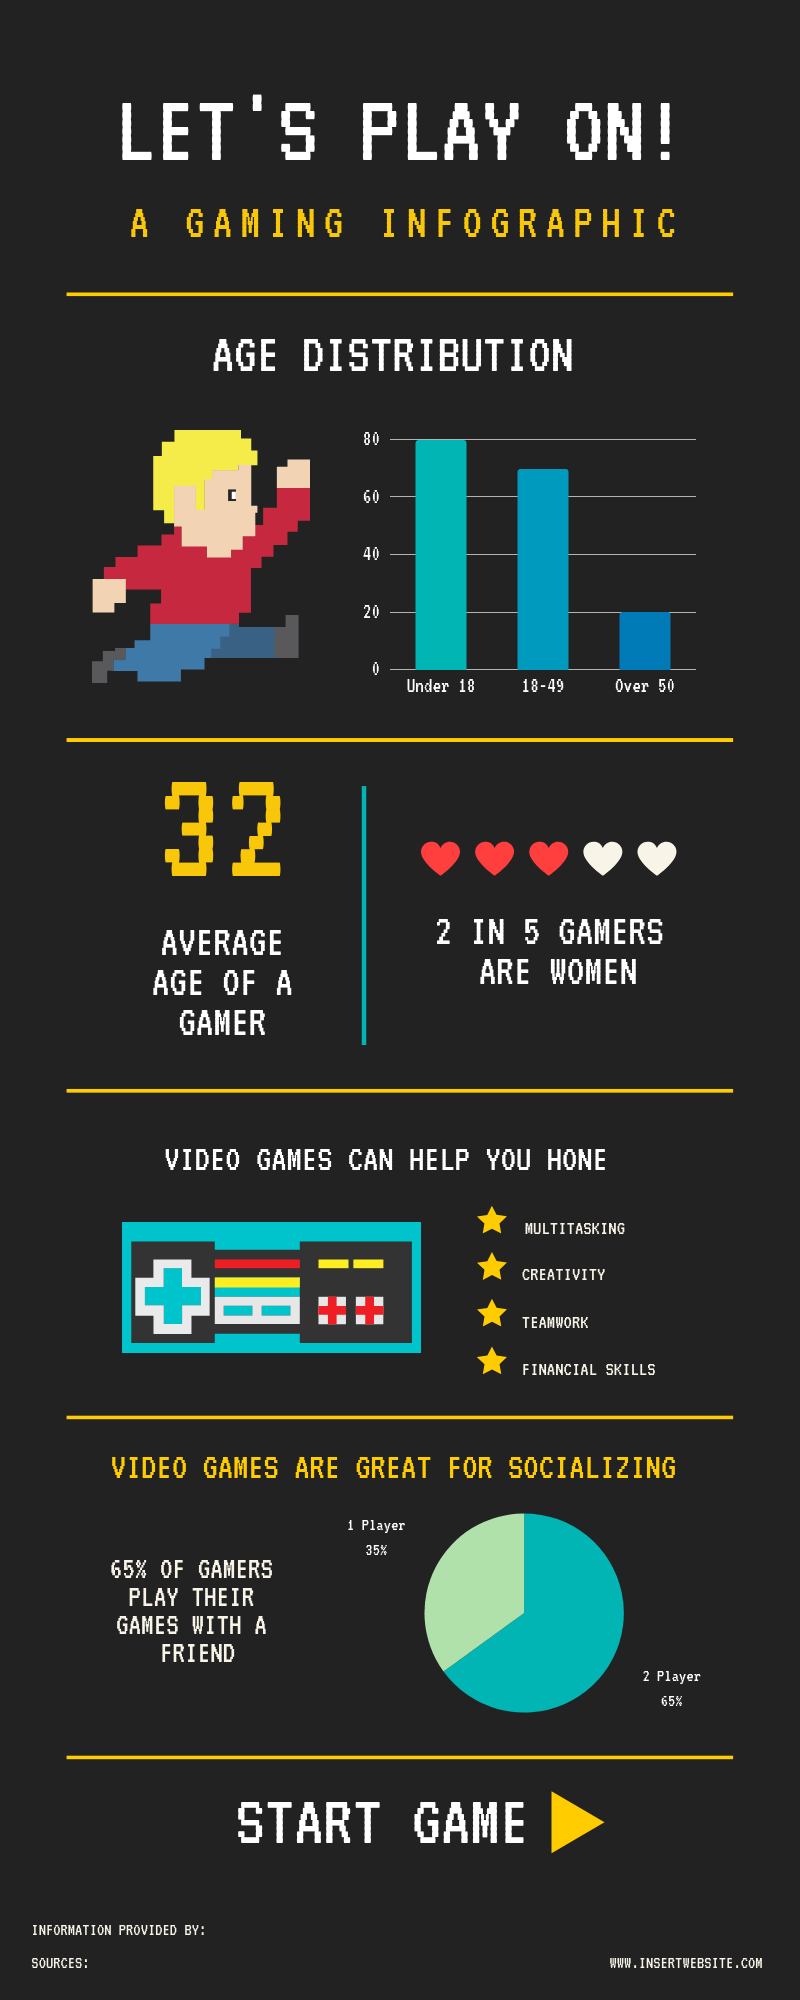
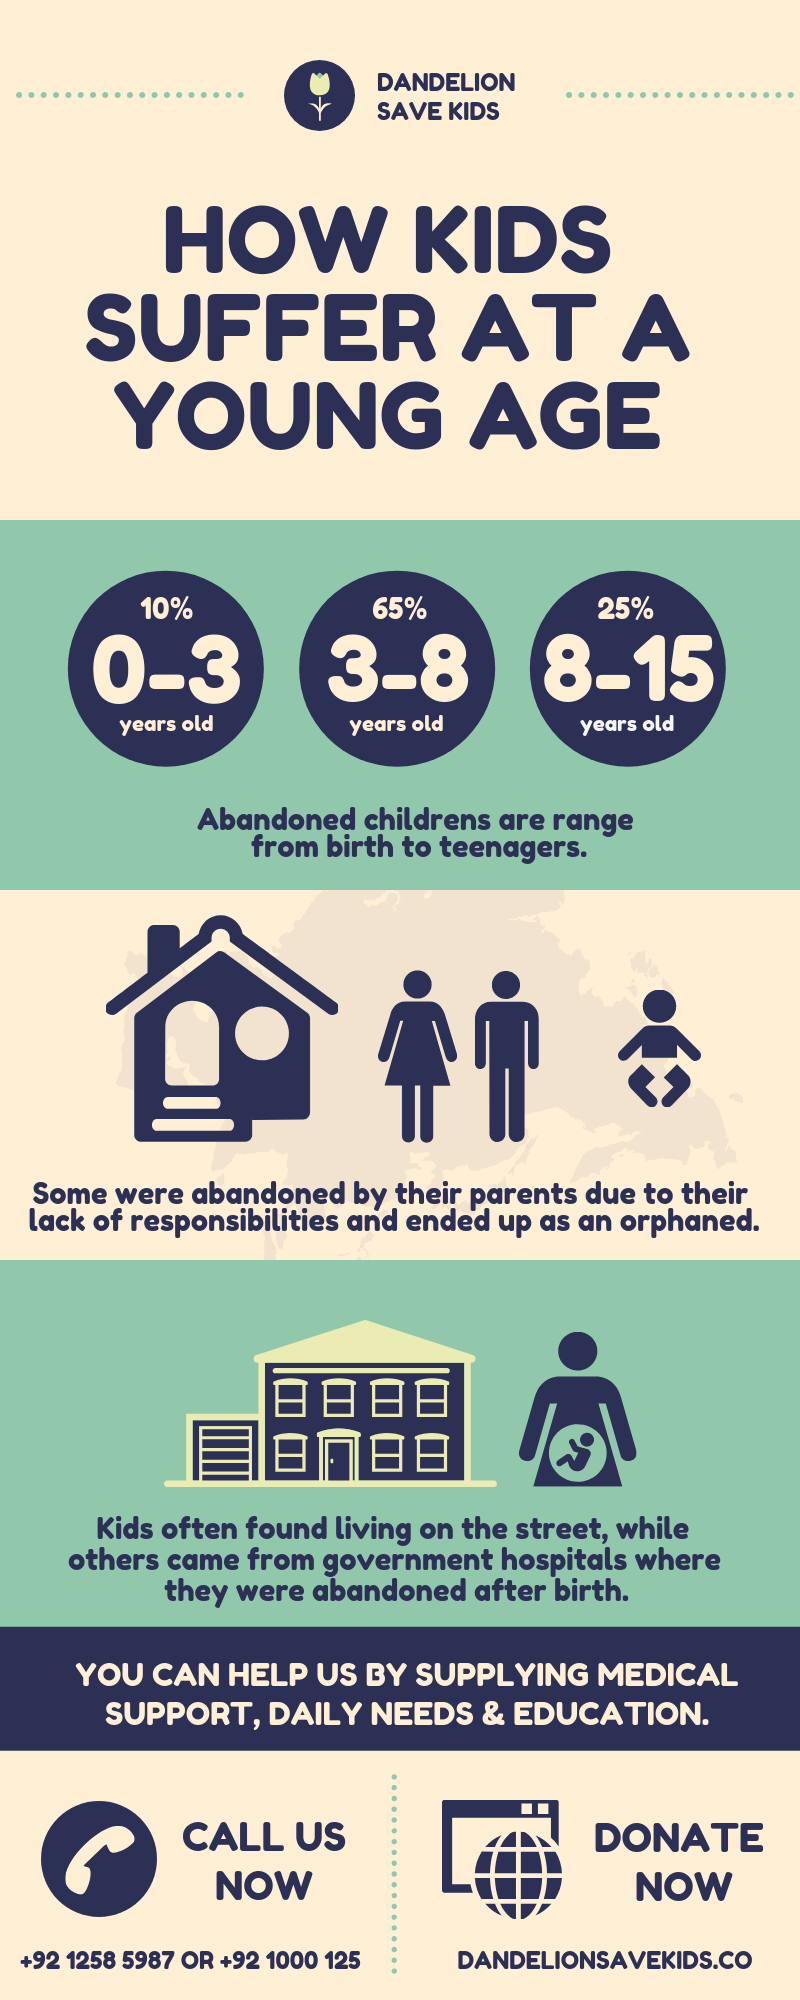
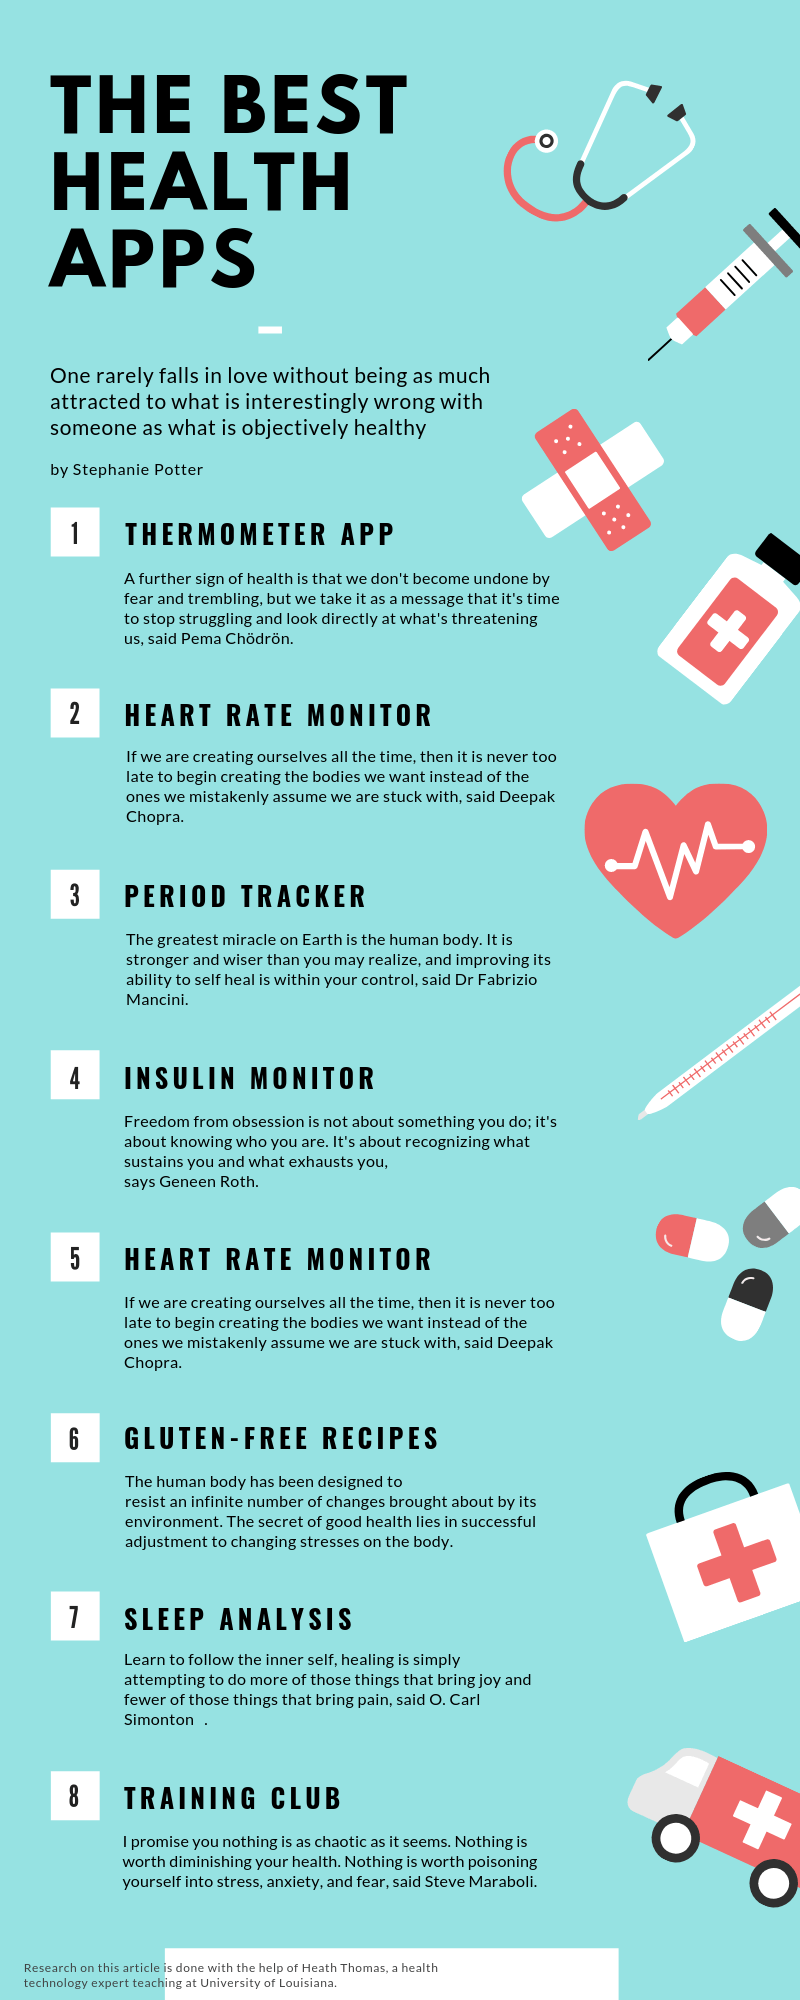
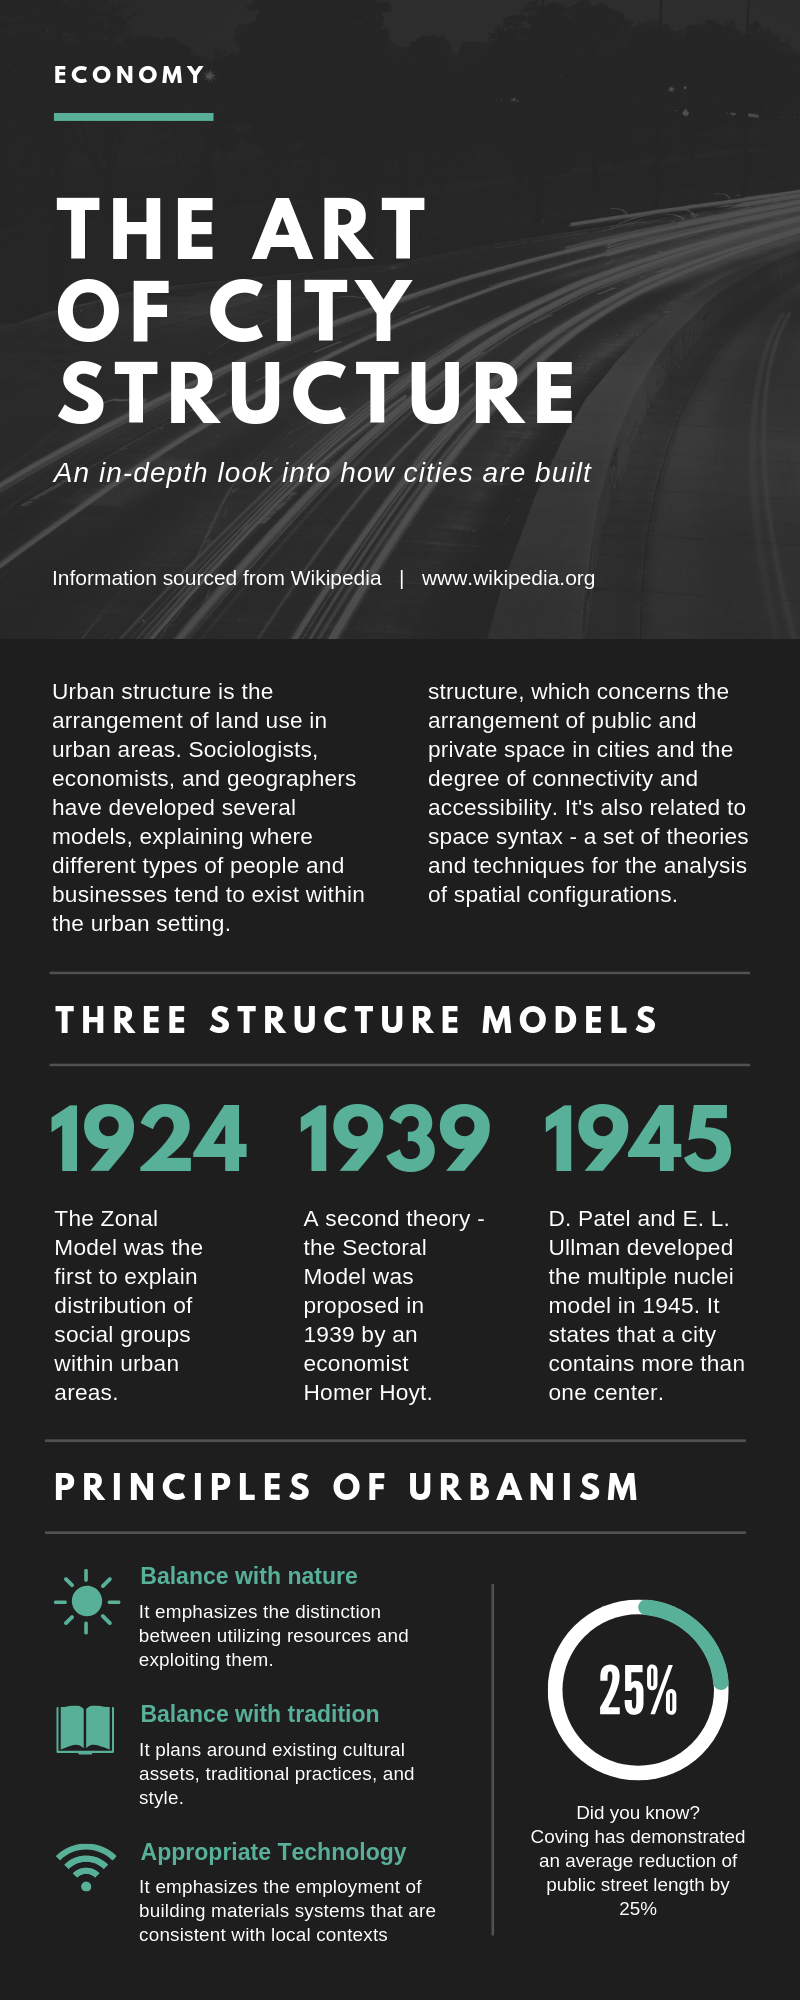
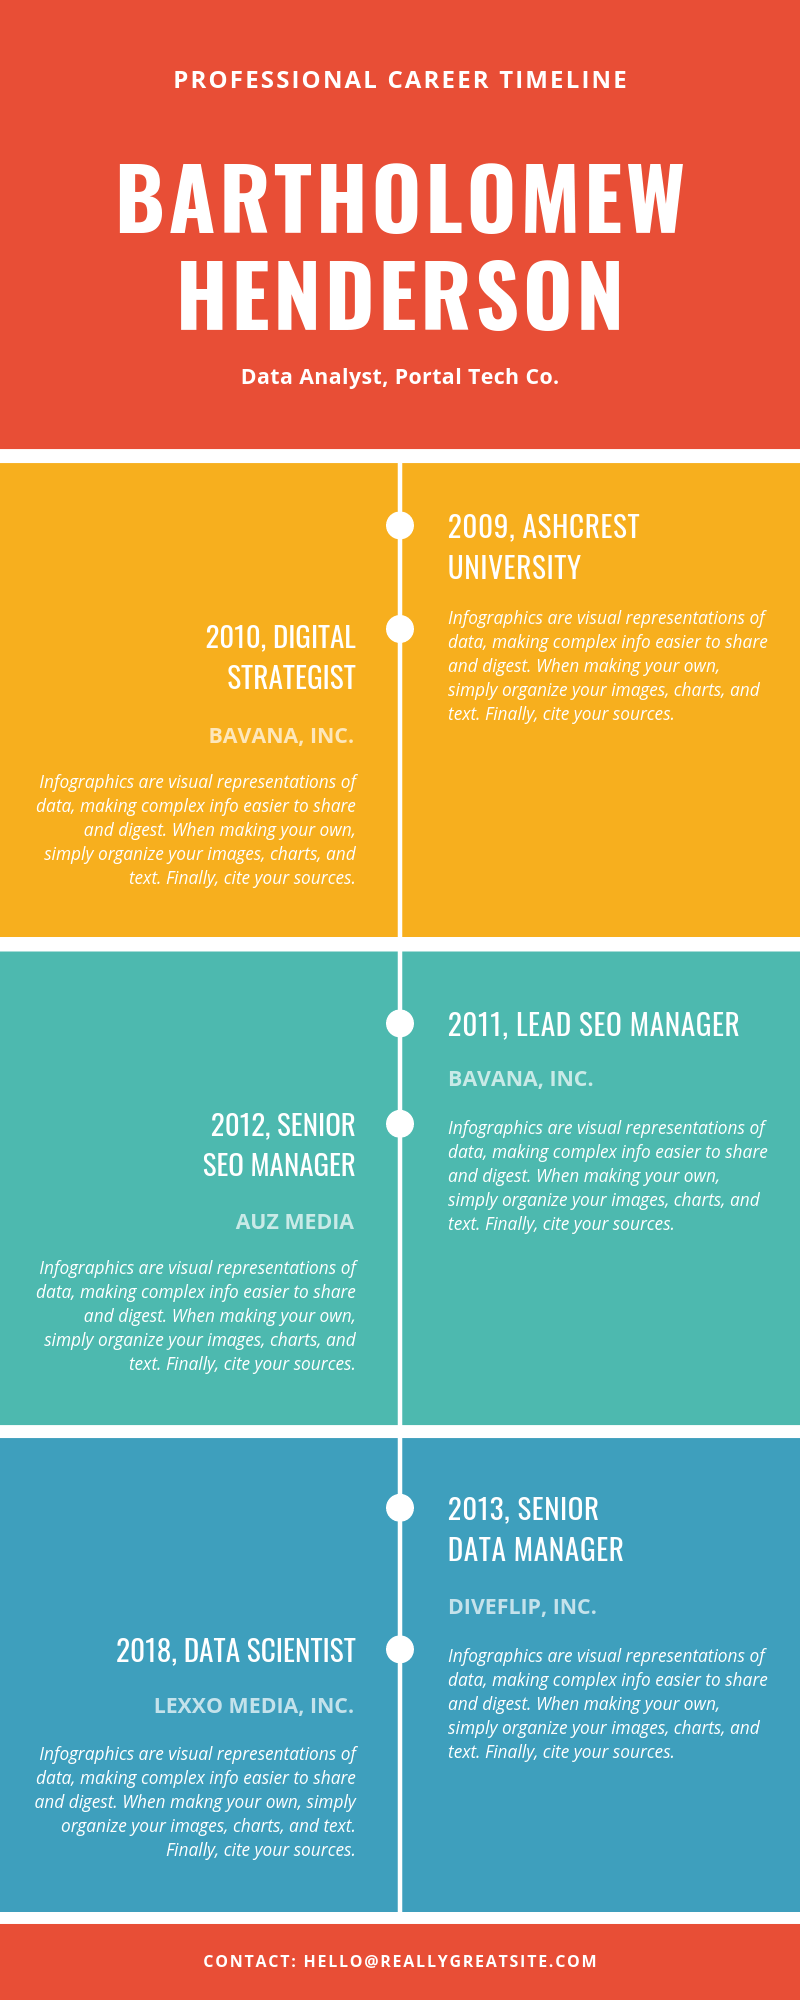
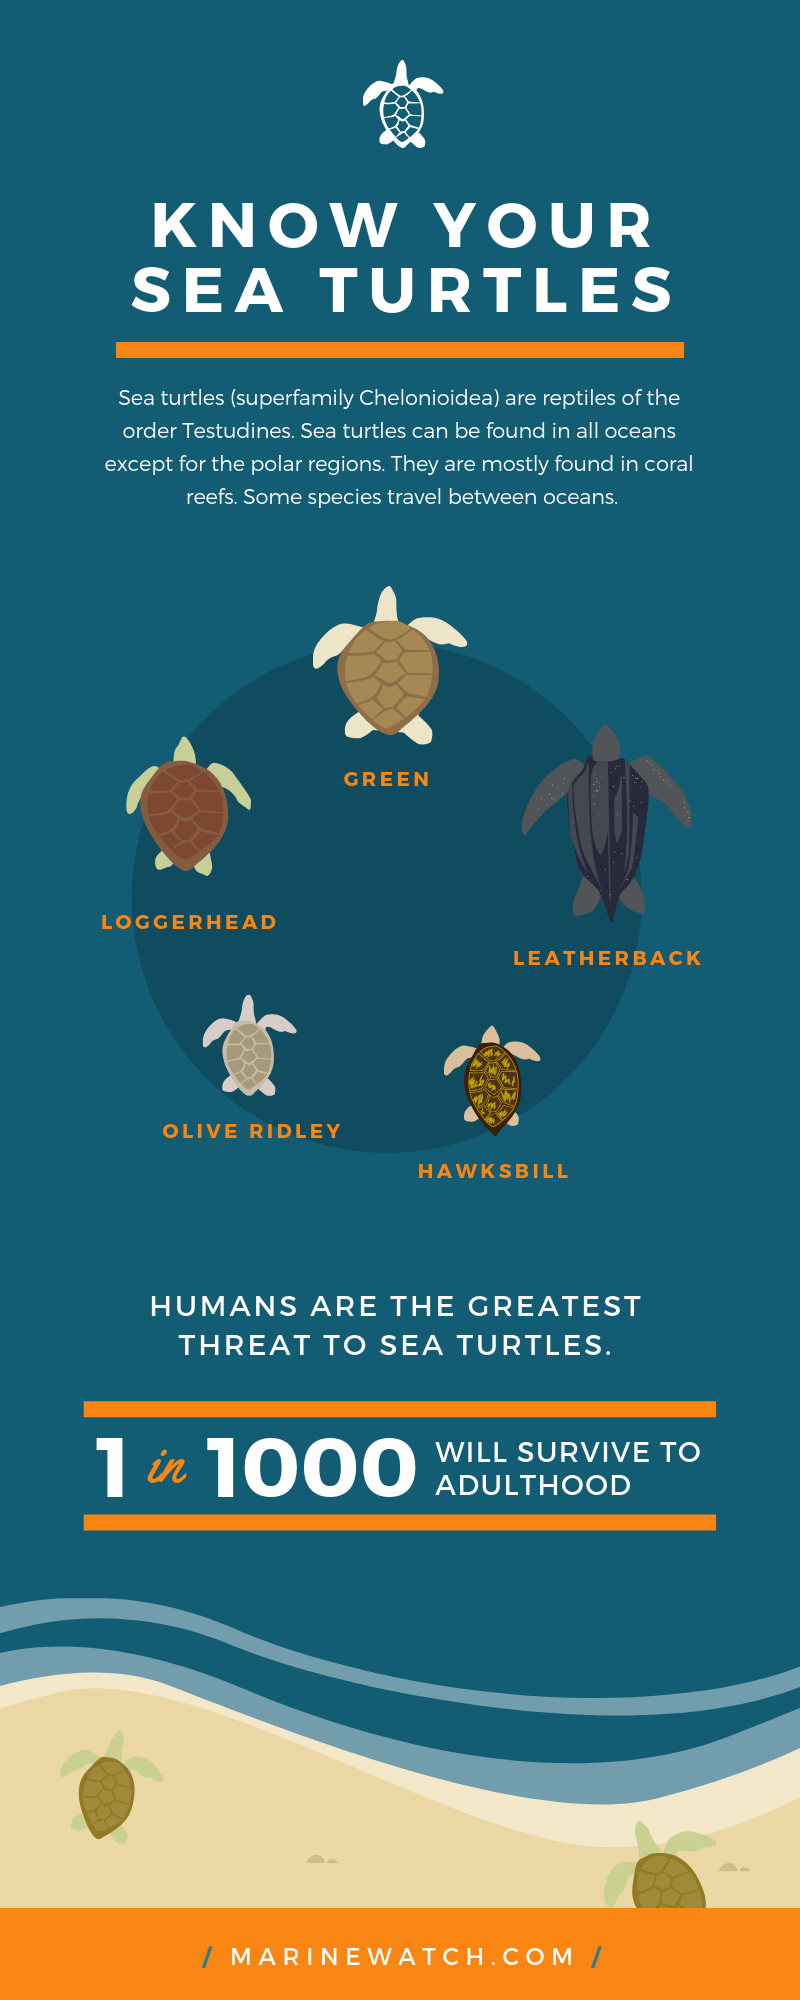
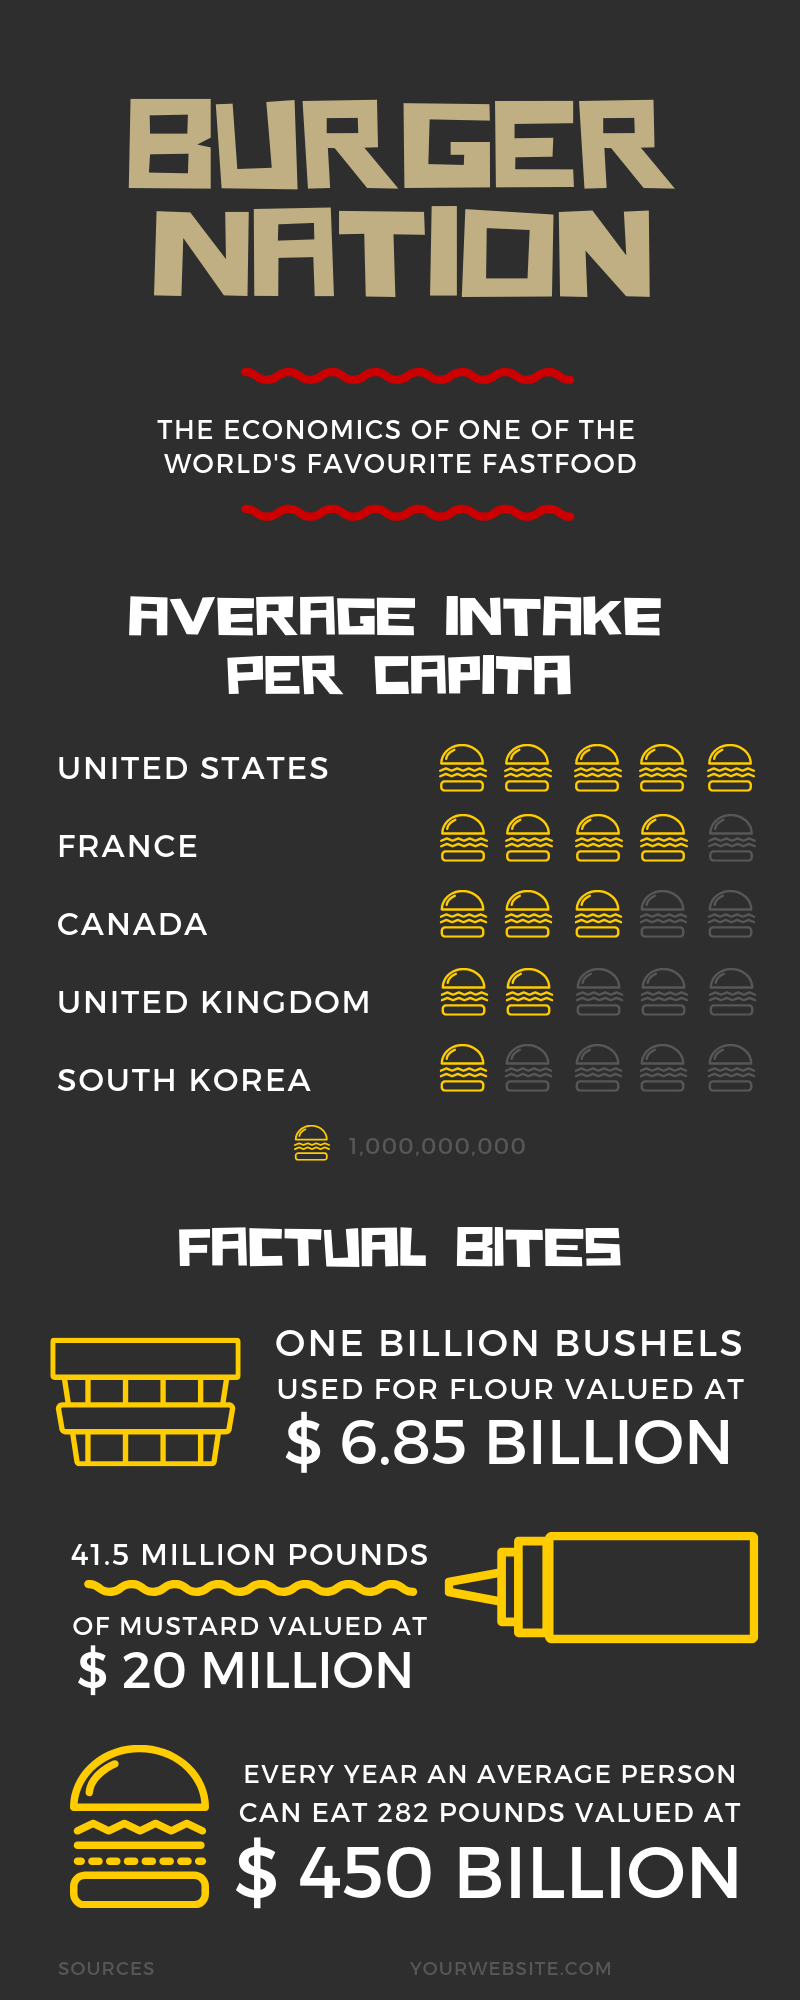
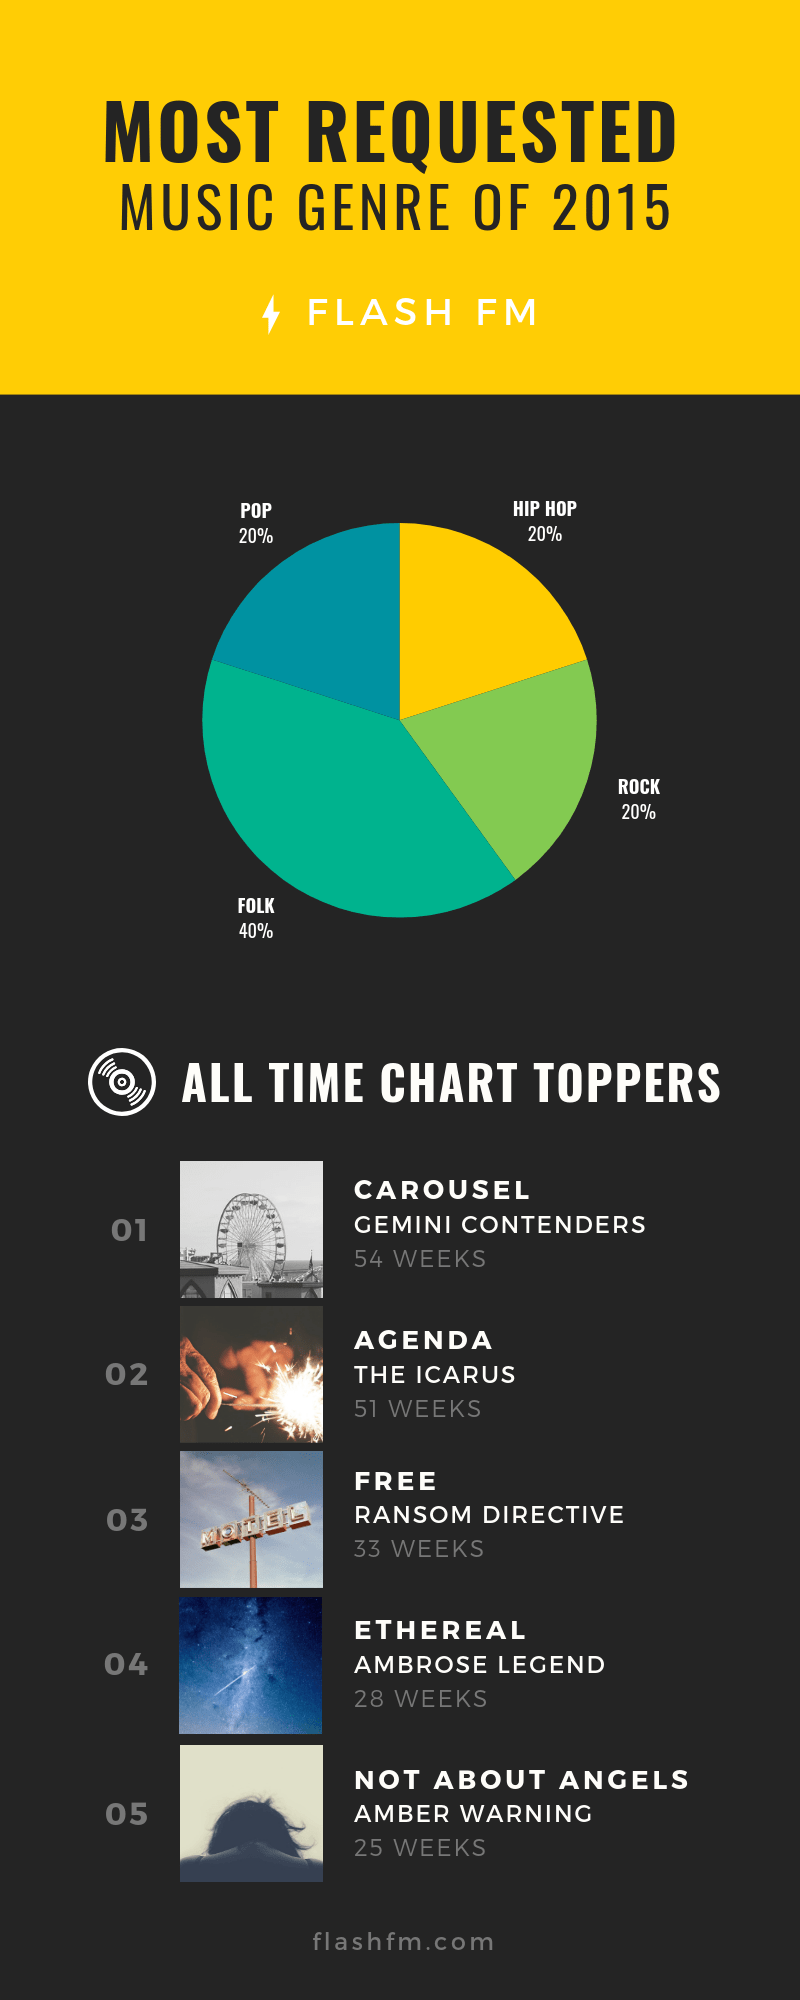
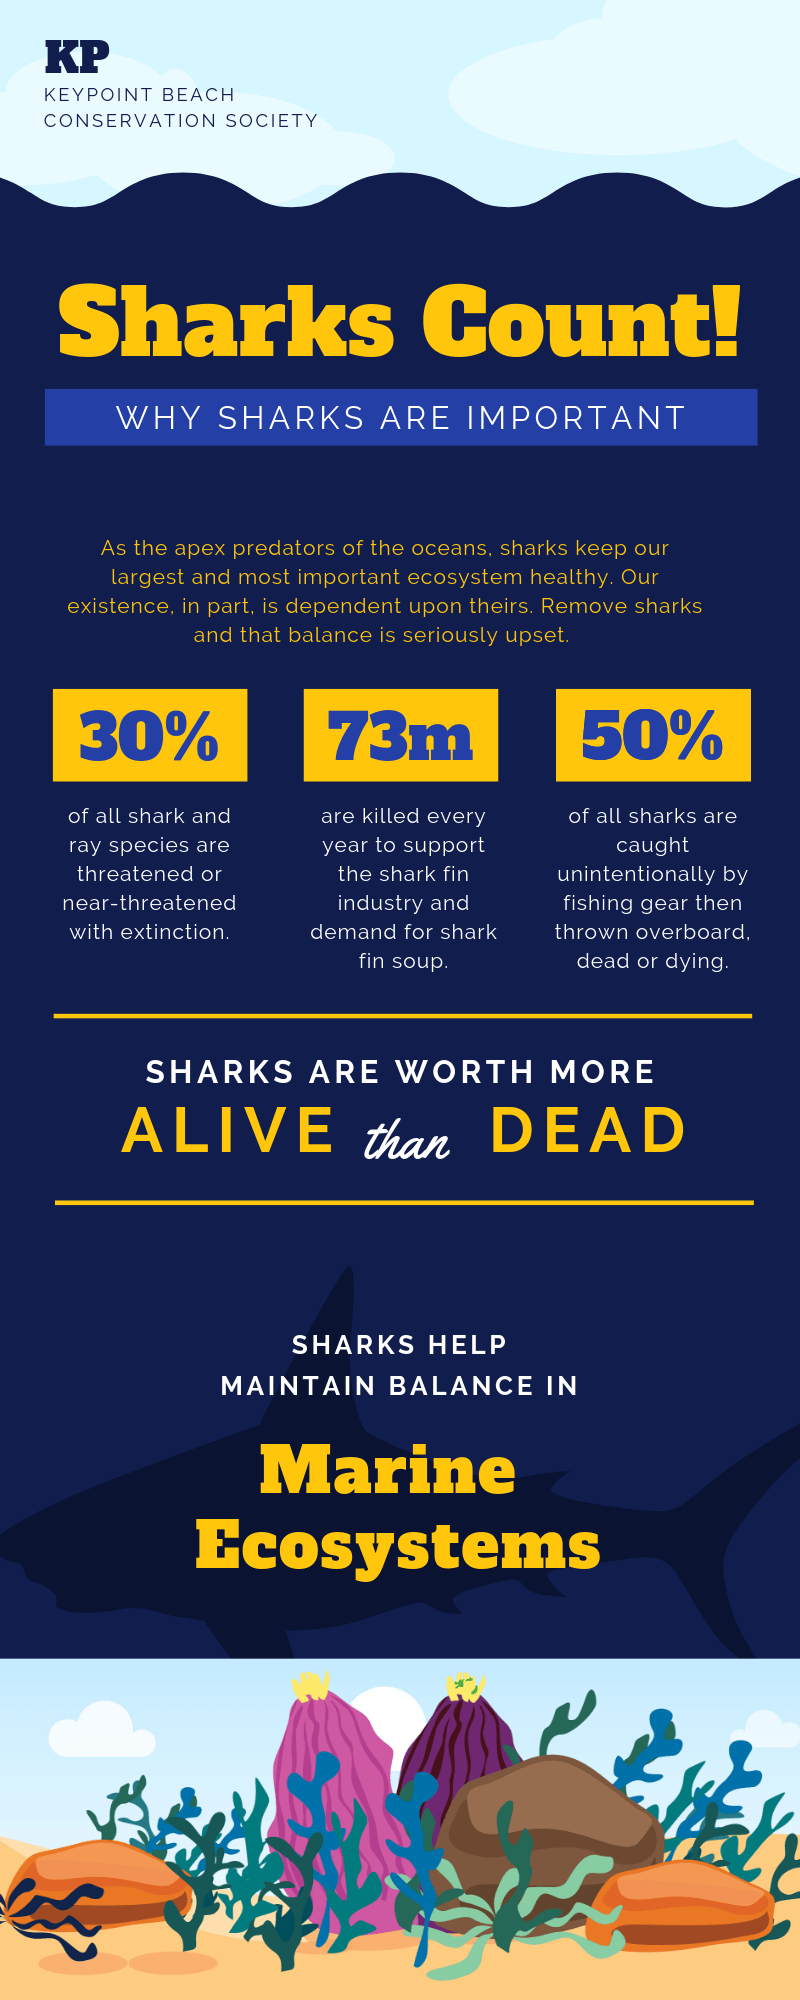
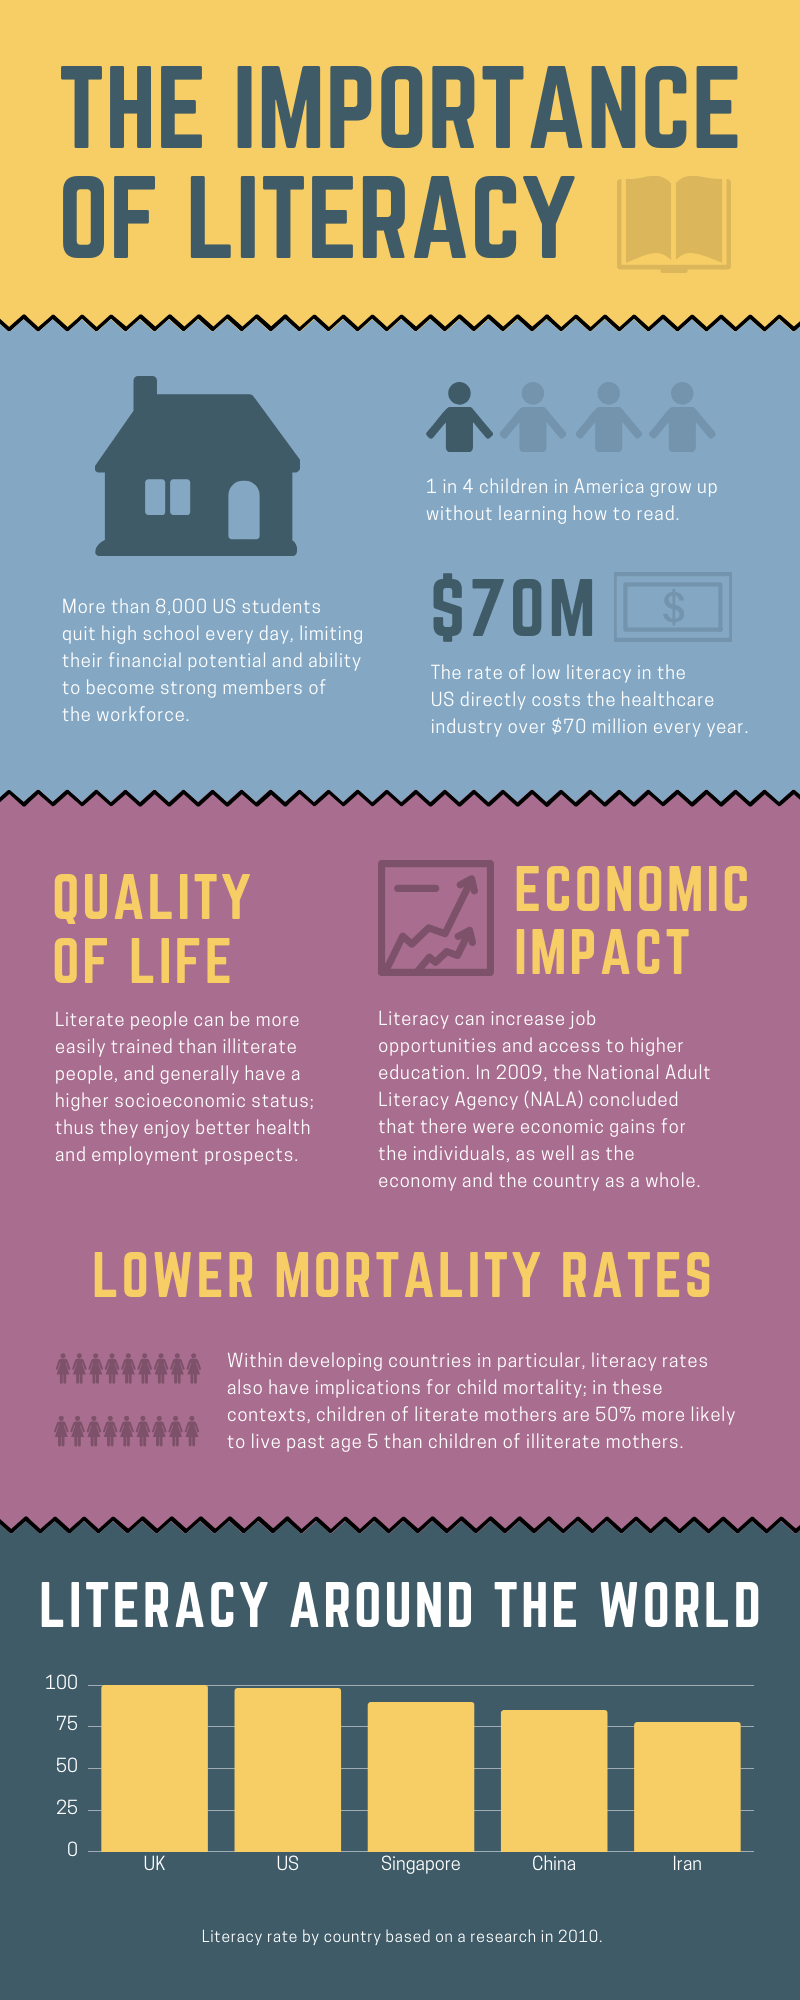
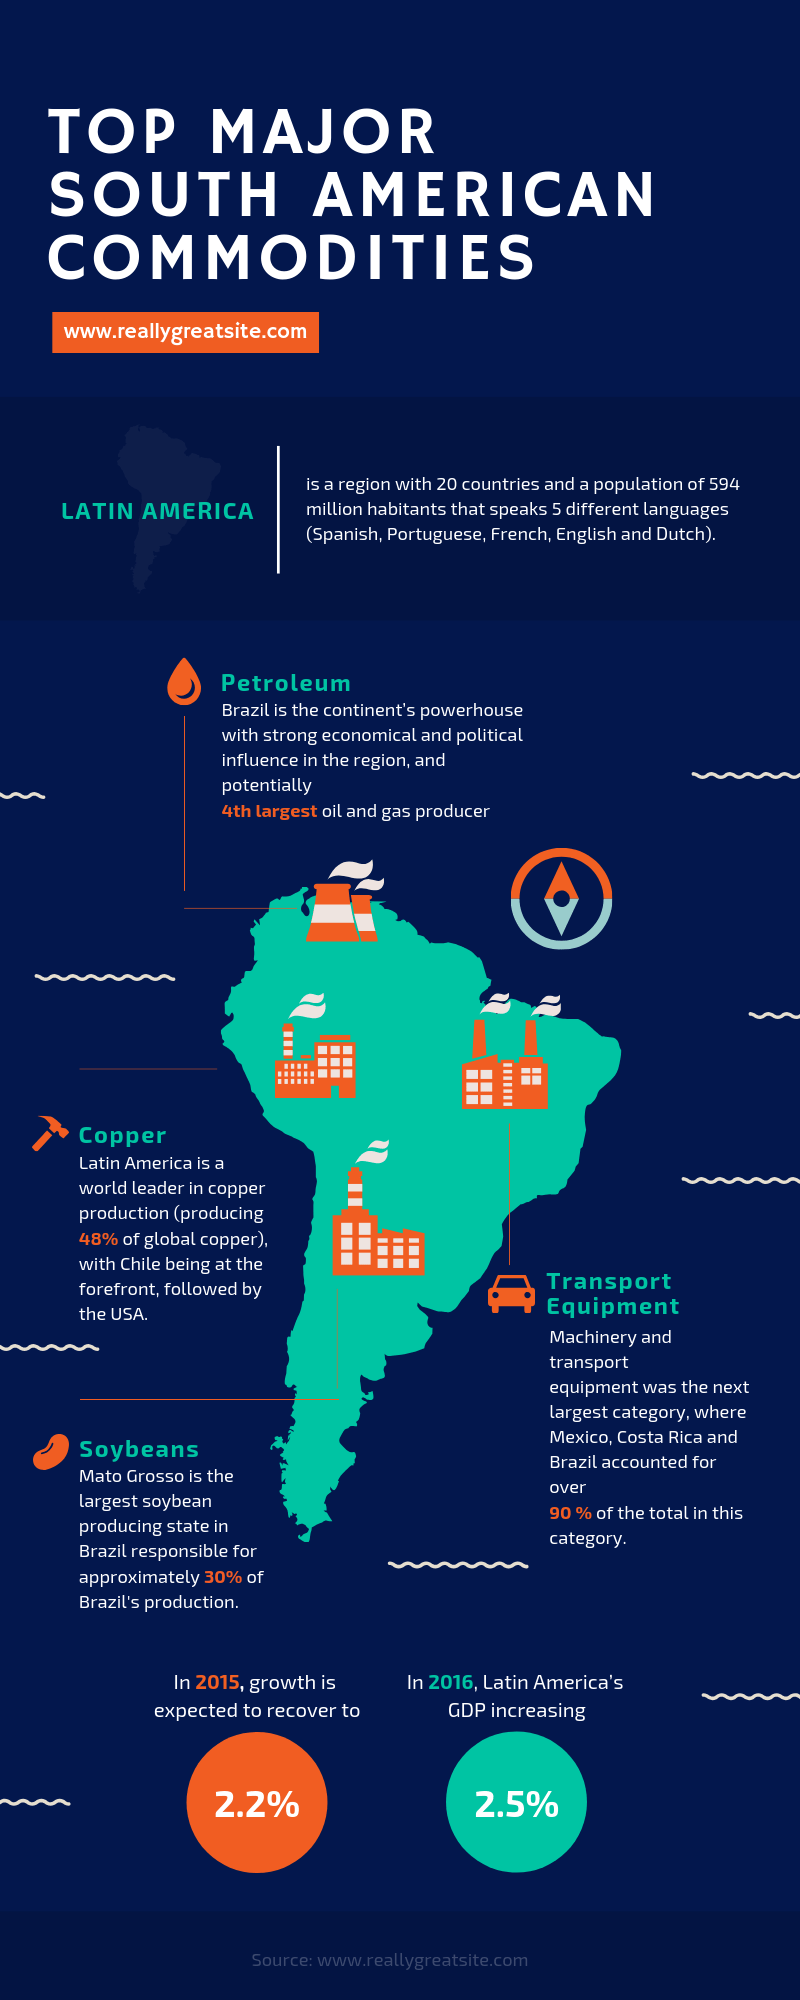
Examples of Infographics You will be Able To Create In Dubai, Abu Dhabi, Sharjah, and UAE
Creating And Using Infographics Course In Dubai, Abu Dhabi, Sharjah, and UAE Value Added Materials
Each participant will receive the following materials for the Creating And Using Infographics course In Dubai, Abu Dhabi, Sharjah, and UAE
Creating And Using Infographics Course In Dubai, Abu Dhabi, Sharjah, and UAE Learner’s Guide
Creating And Using Infographics Course In Dubai, Abu Dhabi, Sharjah, and UAE Handouts
Creating And Using Infographics Course In Dubai, Abu Dhabi, Sharjah, and UAE PPT Slides Used During Course
Creating And Using Infographics Course In Dubai, Abu Dhabi, Sharjah, and UAE Certification
Each course participant will receive a certification of training completion

Course Fees for Creating and Using Infographics Training Course In Dubai, Abu Dhabi, Sharjah, and UAE
There are 4 pricing options available for this Creating And Using Infographics training course In Dubai, Abu Dhabi, Sharjah, and UAE. Course participants not in Dubai, Abu Dhabi, Sharjah, and UAE may choose to sign up for our online Creating And Using Infographics training course In Dubai, Abu Dhabi, Sharjah, and UAE.
  • USD 679.97 For a 60-minute Lunch Talk Session.

  • USD 289.97 For a Half Day Course Per Participant.

  • USD 439.97 For a 1 Day Course Per Participant.

  • USD 589.97 For a 2 Day Course Per Participant.

  • Discounts available for more than 2 participants.

Upcoming Creating And Using Infographics Training Course In Dubai, Abu Dhabi, Sharjah, and UAE Schedule
Contact us for the latest Creating And Using Infographics course In Dubai, Abu Dhabi, Sharjah, and UAE schedules:
Email: contact@knowlesti.ae

Message:

    Download Creating And Using Infographics Course In Dubai, Abu Dhabi, Sharjah, and UAE Brochure
    Request for this Creating And Using Infographics course In Dubai, Abu Dhabi, Sharjah, and UAE brochure. Fill up the short information below and we will send it to you right away!
      Knowles Training Institute Dubai, Abu Dhabi, Sharjah, and UAE
      Fill up the form and we will get back to you in less than 1 working day.

      Alternatively, give us a call to have one of our training consultants contact you. Our corporate training courses can be contextualized to meet your organization’s training needs. Leverage on our large pool of professional trainers and consultants for your organization’s training needs.

      Email: contact@knowlesti.ae

        We Guarantee 100% Privacy. We Respect Your Privacy. Your Information Will Never Be Shared.

        Questions

        Infographics are fast; Text is slow. That is because we comprehend visual patterns quicker than we read the text. They can be thought of as just a map - “infographic” is simply a new name for an old thing. They are rich maps for information in general. So they lessen the complexity of voluminous data. 
        There are many websites or applications to use for creating infographics. Here are some of them: Canva, Piktochart, Venngage, Adobe Spark, Microsoft Word, Microsoft Powerpoint, easel.ly, Visme, Infogram, Vizualize.me, Snappa, Animaker, BeFunky, Biteable, and Mind the Graph.
        1. A Targeted Audience Find out what the target audience wants - do research. 2. A Compelling Theme A theme is essentially the business’s story. It requires synthesis with the brand, as the infographic will be a stepping-stone for the marketing campaign. 3. Actionable Data Find statistics to demonstrate to the target audience that the product or service is the solution they need.  4. Awesome Graphics The graphics will guide the target audience through the story.
        Here are tips for creating a useful infographic: Write a snappy headline. Leave sufficient white space.  Create it for a target audience.  Minimum text. Adhere to a single topic. The information should be like a story.  Make a case by presenting facts and data.  Use two computer fonts at the most - using more creates disharmony.
        The 7 Steps To Create Awesome Infographics Step 1: Ideate Look to see if there are other infographics out there that have already covered the potential idea.    Step 2: Research, Plan And Write Take the time to plan out the structure and writing of the infographic’s content.    Step 3: Choose Colors Colours account for 85% of the reason why people make a purchase.   Step 4: Select Font(s) The right font choices add ambience and personality to the infographic, while the wrong font clutters and obscures the information.   Step 5: Determine Infographic Orientation And Visual Hierarchy Think about the wireframe and orientation of the infographic. 
        A recruiting tool Designers have long used infographics on resumes as a way of summarising their careers and bring to light unique skill sets. Presenting survey data Infographics are highly useful for presenting results gathered from survey data. They make data understandable and quickly convey the gist to the readers. Simplifying a complicated concept Infographics simplify a complex idea which makes them excellent instructional tools, for example, when presenting an overview of a topic. Explaining how something works Infographics reveal the mechanics behind how intricate objects work.
        Nine popular infographic types are: Statistical - visualise survey results Informational - communicating a concept or summary of a topic Timeline - visualising important history events Process - presenting an overview of steps Geographic - reflect location-based or demographic data Comparison - contrast options in an unbiased way Hierarchical - compare information from greatest to least. List - share a collection of tips, or a list of resources, or a list of examples Resume - a great visual document to bring to an interview
        1. Descriptive Title and Subheads Infographics simplify complex data by a simple visual structure.  2. Informative Statistics Valuable, relevant, and of course — accurate with cited sources. 3. Bold, Thematically Appropriate Color Scheme Choose a bold colour scheme that aligns with the intended message. 4. Eye-catching graphics To stand out to a digital audience with numerous choices for sourcing information, use eye-catching graphics. 5. Organised and Sequential Story People want a compelling narrative that is well-structured and intentionally ordered.
        1. The Story The purpose of an infographic is to narrate a story. 2. Data Accurate data is paramount for an infographic. 3. Design Base the design of an infographic on the story. Use a maximum of three colours for the colour scheme. Ensure the fonts used are legible in both large text and small text. 4. Graphs and Charts They depend on the story. For example, when visualizing data about people, use human silhouettes in a chart. Substitute numbers with graphical parts when applicable.
        Infographics are some of the most useful tools for a business. Unlike other advertisements, people can easily share infographics. They attract attention from a broad audience because they are easy to read and usually fun.
        In Word, use the regular A4 template or another appropriate template. See the insert tab and click on it in the top right-hand corner of the toolbar, to insert an assortment of different graphs, shapes, and pictures into the document.
        To make an infographic using Powerpoint, resize the slides to the appropriate size used by infographics. Different platforms have different recommended sizes, so you have to consider as well where you’re going to be posting or sharing your PowerPoint infographic. Go to Design, Slide size, and then Custom Slide Size. In the Slide Size dialogue box that pops-up, select Custom in the drop-down for Slides sized for.
        Use timeline infographics to visualise a process over some time, to portray the history of a particular event. They typically have a very linear progression and are useful for creating a company fact sheet or outlining a step-by-step process for achieving a specific task.
        People find it troublesome to navigate through a myriad of lines of numbers and statistics online. Using infographics is a clear, practical and artistic way of presenting information without draining the viewer’s effort to pay attention. Infographics allow people to digest information quickly. With the proper use of colour, proportion, and negative space, information can be converted into attention-grabbing and persuasive graphics.
        Humans are visual people by nature. We understand images more quickly than text. Images are comparatively easy to process, especially if they make sense in context. As a result, they can make digesting information easier if they effectively illustrate the intended message and make complicated information easier to understand.
        Consider using infographics in these areas: Social media Get views and click-throughs for the organisation’s website. Email marketing Email leads and contacts with infographics to supplement relevant information. Website and blog To post on the landing page so that it has a URL that can be shared. Additionally, include HTML sharing and embedding data to promote the infographic. White papers To demonstrate the arguments made and affect the reader. Press Release Publish surprising findings using infographics to grab the viewer’s attention, spreading it via word-of-mouth.
        Search volume for infographics has erupted over the past few years. Audiences love infographics as they are visually apparent, easy to share and contribute something of value with little time required.  The most popular visuals share common characteristics such as height, width, character count and colour palette.
        Infographics Training Course in Dubai, Abu Dhabi, Sharjah, Al Ain, Ajman, Al Gharbia, Ras Al Khaimah, Fujairah, Dibba, Um Al Quwain. Infographics Training Course workshop, training, class, seminar, talk, program, programmed, activity, lecture. Infographics Training Courses, workshops, classes, seminars, talks, programs, programmed, activities, lectures in UAE. Infographics Training improvement tips, Infographics Training techniques, improve Infographics Training, improve Infographics Training games, Infographics Training improvement exercises, improve Infographics Training power, how to have good Infographics Training, how to have good Infographics Training in studying, how to build up your Infographics Training, how to improve Infographics Training how to improve Infographics Training Course in UAE. Enhance, boost, build up, enlarge, heighten Infographics Training Course in UAE. Increase, intensify, raise, reinforce, strengthen Infographics Training. Upgrade, amplify, boom, elevate, exaggerate, magnify, grow, gain Infographics Training. Develop Infographics Training, multiple, power up, beef up, bolster, establish, extend Infographics Training. Invigorate, restore, step up, toughen, empower, fortify, regenerate Infographics Training. Rejuvenate, renew, escalate, expand, maximize Infographics Training. Powerful, mighty, impressive, competent, great, excellent, exceptional Infographics Training in UAE. Superb Infographics Training. Super, superior, strong, solid, active Infographics Training Courses and workshops in UAE. Infographics Training enhancement, booster, building up, enlargement, heightening, increment, strengthening, amplification. Infographics Training magnification, growth, development, power, empowerment, regeneration. Infographics Training rejuvenation, development, escalation, expansion. Infographics Training maximization, power training Courses & workshops in UAE.